The Eastern Desert of Egypt is a highly prospective region for mineral exploration, and with the 2023 Gold and Associated Minerals bid round well underway, it is the perfect timely playground for remote sensing. The image below shows some initial basic outputs from imagery acquired by the EMIT hyperspectral sensor, currently hitching a ride on the ISS. They clearly demonstrate the insight we can begin to glean from satellite hyperspectral data, and this is before we even look at high spatial resolution imagery and elevation data.
Identifying representative endmember pixels, and analyzing their spectral curves gives insights into the geological processes they represent. Unmixing these endmembers to find the corresponding abundance maps shows the distribution of these processes across the Earth’s surface. However, before we get ahead of ourselves and start disregarding geological maps and pointing the finger at endmembers, it is important to understand the limitations and uncertainties that come with this remote sensing technique.
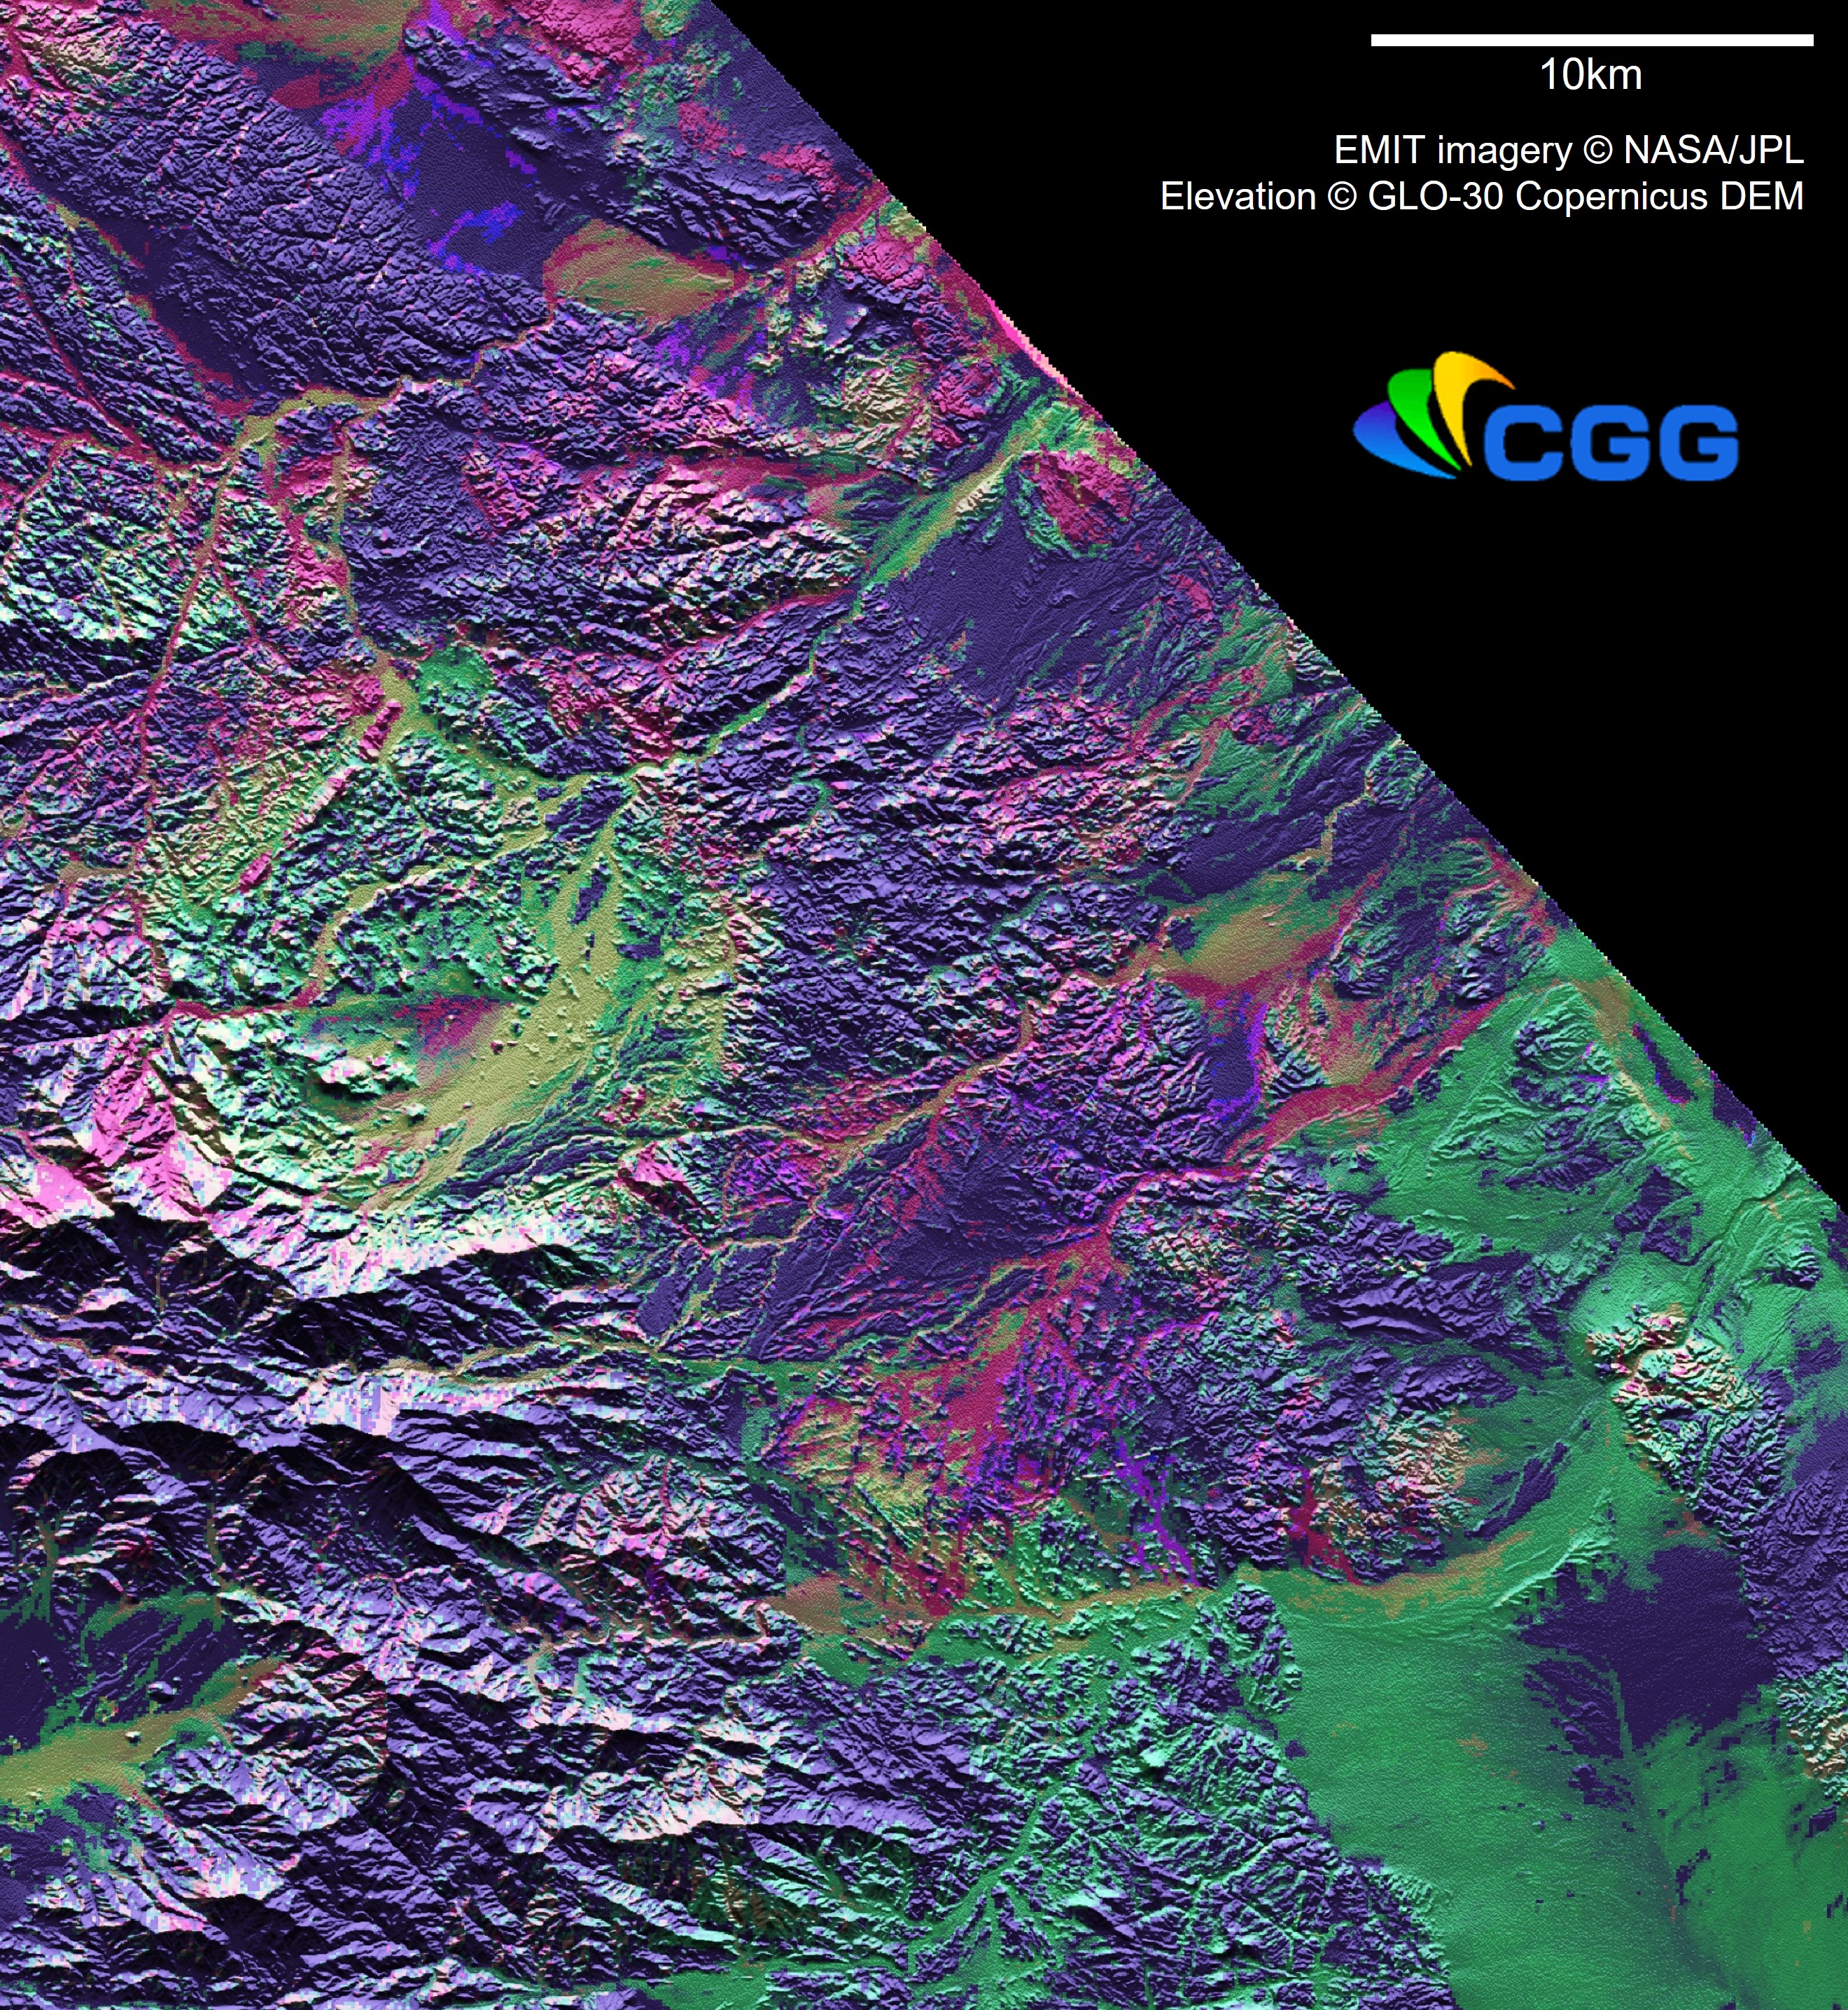
In the above example, three endmembers representing the most disparate spectral signatures were selected. The red band highlights compositionally mature material, likely representing extensive chemical weathering and the production of quartz-rich material, such as terrestrial sand cover. The green band highlights clays such as illite and muscovite which form in a range of environments from various geological processes. It will also cause some slight response in Mg-OH bearing minerals and carbonates, and this must all be considered during interpretation. The blue band preferentially highlights carbonates such as calcite, but also causes some response in Mg-OH bearing minerals such as actinolite. Given that many of these endmembers may show degrees of responses across different bands, and may result from lithological or alteration processes, interpretation is far from a trivial ‘point the finger’ exercise. In addition, having spectral information from 285 bands that EMIT provides, it is impossible to represent the full high dimensionality of these data in three color channels alone, and far more distinctions can be made than are observed in the image.
We also need to consider the size of the pixels we are dealing with – in this EMIT case they equate to approximately 60m X 60m on the ground. That’s quite a large area – just shy of 14 tessellated tennis courts – and so you can imagine there will be quite a mixture of geological (and possibly non-geological) bits and pieces within a single pixel. We can go some way to ‘un-mix’ the jumble of spectra, but unmixing will not just depend on the endmember we’re wanting to display, but also how similar the other endmembers are. What we can say with some degree of certainty, is that some spectral absorption features observed across a given pixel show a statistically closer resemblance to say, clay minerals than fe-oxides, for example, and which of these are more dominant than others. We can also start to analyze specific characteristics of the absorption features which allow us to begin distinguishing one clay mineral, such as illite, from another, thanks to the sensitivity of hyperspectral data. What we can’t determine, particularly at this Grand Slam resolution is which of the 14 tennis courts contain the 'probable illite'.
This may seem to be taking some of the prettiness out of the spectral mapping picture, but it is not intended to. Spectral mapping is a highly effective and valuable tool in the mineral exploration toolkit, but all too often we see maps of spectral outputs being presented that definitively assign specific minerals to a given pixel. Yes, a pixel may contain illite, but it may not. Or it may contain an assemblage of clay minerals that might include illite in some proportion.
To begin reducing these inherent uncertainties and unwanted noise, we need geological context. This is vital, and unless you have expansive field data, geological maps should be the first port of call. These provide a lithological and structural backdrop to the spectral outputs and will assist a geologically sensible interpretation. However, scale and reliability are key. The value gained from aligning hyperspectral results (even those with a coarse spatial resolution) against a regional 1:1 million scale geological map, is limited; and assuming published geological maps are accurate and correct can be disastrous. As such, having the ability to generate an accurate, detailed structural framework and lithological setting at the appropriate scale is invaluable, and in our opinion should be an integral part of any spectral mapping project. In the Egypt example shown above, we will typically generate a 1:25,000 scale geological interpretation from a combination of satellite optical, radar and elevation data, supported by published geological maps, reports and any geophysics and/or field data that may be available. When integrated with the spectral results, it enables us to take more confident steps towards the pointy end of the mineral exploration process. Target areas can begin to be ringfenced for follow-on work, such as 1:5,000 scale multispectral and structural mapping. We can do this too, using optical imagery sharp enough to distinguish compositional variability in sub-meter wide dykes, and focus boots on the ground fieldwork.
Egypt is just one of a multitude of prospective geographies we are currently working on, supporting our clients with honest expertise, from project concept to delivery. If you'd like to know more about what we are up to, drop us a line.