As the longest running commercial provider of InSAR, CGG have delivered solutions to a wide variety of sectors. Of these, the infrastructure and engineering sector has presented some of our most interesting studies. The application of InSAR can lead to improved safety, more efficient resource allocation, better planning and design practices, and enhanced decision-making processes. Here, we demonstrate InSAR’s ability to monitor and support the development and management of a critical infrastructure project.
Critical infrastructure plays an integral role in society today. As we shift toward a more sustainable future, it is vital that regular monitoring is undertaken to ensure the safety and integrity of these structures. CGG’s satellite deformation detection, backed by high-power computing, provides rapid insights into the status of an asset with millimetric precision.
Water dams enable the control and distribution of water supplies, in addition to carbon offsetting through hydroelectric power generation. However, the often isolated and inaccessible locations of dams mean that ground-based investigation techniques can be extremely difficult and potentially dangerous to implement. CGG’s satellite-derived deformation monitoring, known as InSAR, provides an accurate and remote solution to detect short- and long-term displacement anomalies, aiding risk management.
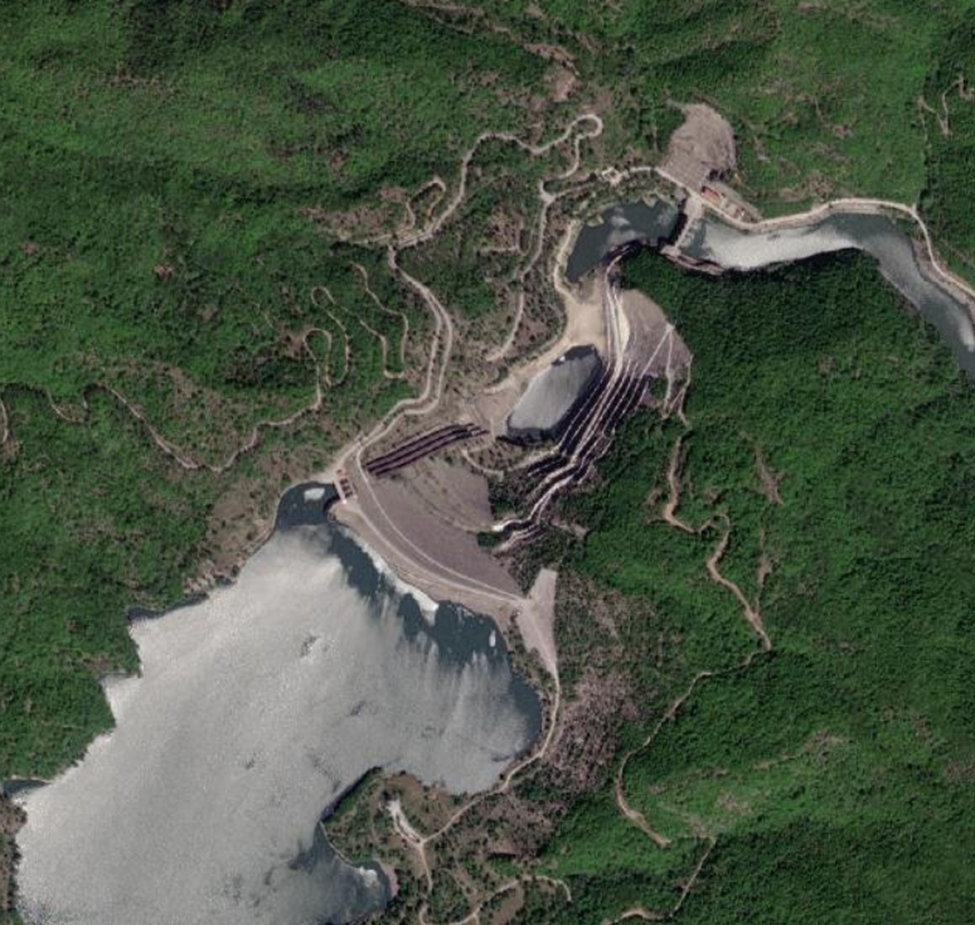
The Thisavros Dam, on the Nestos River in north-eastern Greece, is a 172m high rock-fill dam - the tallest of its kind in Greece. The structure supplies hydroelectric power and irrigation solutions to the local area. The dam’s location is close to the border with Bulgaria, in a seismically active region characterized by rugged, mountainous terrain, complex, highly faulted, and sheared geology and complicated hydrogeological conditions. Consequently, dam construction and stabilization were extremely challenging (Anastassopoulos et al., 2004), and two large landslides that occurred during construction required significant, time-consuming remedial measures and major adjustments to the project design. Construction at the site lasted for 10 years, ending in 1996 with the commencement of reservoir filling. More than a decade after completion, another major failure occurred at the right abutment of the dam where a broad shear zone intersects a steep slope of hydrothermally altered and weathered rock mass (Loupasakis et al., 2011).
Thisavros is a good candidate for InSAR analysis for several reasons. Firstly, the man-made embankment acts as a reflective surface to consistently reflect radar waves back to the satellite. Secondly, surface conditions do not change on the embankment and the size of the dam is easily resolvable in open-access Sentinel-1 radar images. Finally, the age of the dam allows a long-term study of deformation to be undertaken. These advantages are common across many large infrastructure projects, making InSAR an effective and valuable tool in monitoring the built environment.
CGG utilised Sentinel-1 SAR imagery (~20 m spatial resolution) spanning 5 years to derive the long-term deformation trends, including seasonal variations. Displacement was determined from January 2018 to February 2023 using both the ascending and descending lines of sight (LOS). By considering the radar's viewing angle, incidence angle, and satellite geometry, it is possible to calculate the vertical and east-west horizontal components of deformation using trigonometric relationships.
Displacement results are shown below. There is a clear vertical subsidence trend of up to -5 mm/yr across the dam, decreasing away from the centre. A consistent trend is observed in the horizontal result, where displacement is orientated towards the centre of the subsidence bowl.
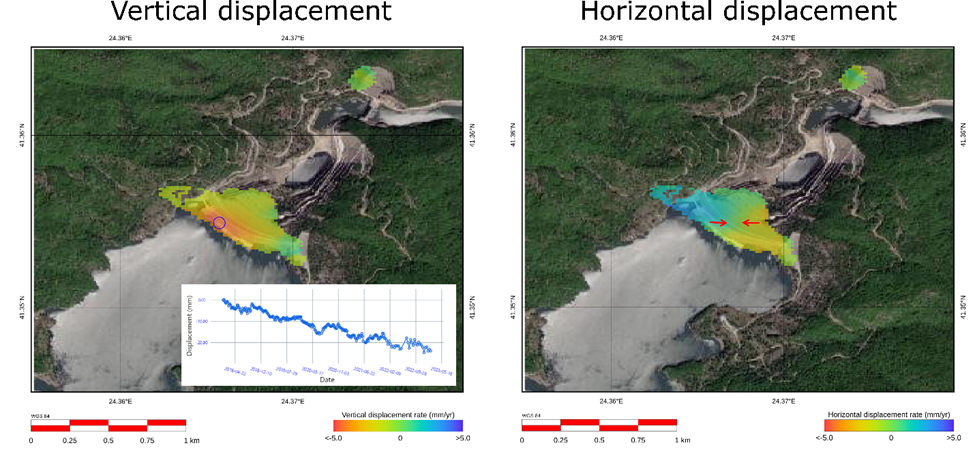
Displacement maps serve as a valuable tool to gain comprehensive insights into the spatial patterns of displacement. However, conducting time series analysis is equally important. Here, the CGG Satellite Mapping ArcPro toolbox was utilised. Not only does the time series in Figure 2 depict the long-term subsidence pattern indicated by the displacement rate maps, but it also reveals a short-term seasonal variation.
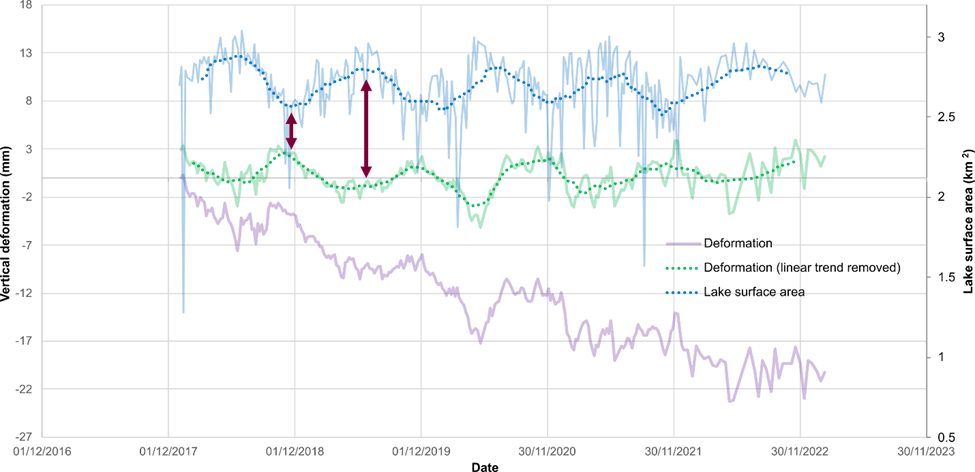
Seasonal deformation trends can occur for several reasons, e.g., fluctuations in soil moisture, groundwater extraction, thermal expansion, freeze-thaw cycles. Figure 3 shows a time lapse of radar images across the reservoir over the 5-year study period. The level of the lake varies significantly, peaking in the summer and reaching a minimum in the winter. The surface area of the reservoir was calculated from the radar images and plotted as a function of time in Figure 4.
Once the linear subsidence trend is removed from the vertical deformation record, Figure 4 shows an antiphase correlation between the lake surface area and vertical deformation. It is likely that high water levels during the summer exert greater pressure on the dam, causing it to subside. When the pressure is relieved in the winter, the dam rebounds.
A consistent trend is shown in the horizontal results (Figure 5). In this case, the long-term trend is movement towards the centre of the dam (i.e., area of greatest subsidence). However, on average, the entire dam is moving to the east at a rate of ~1 mm/yr. In the short term, the entire dam moves towards the east (i.e., downstream) in summer and towards the west (upstream) in winter.
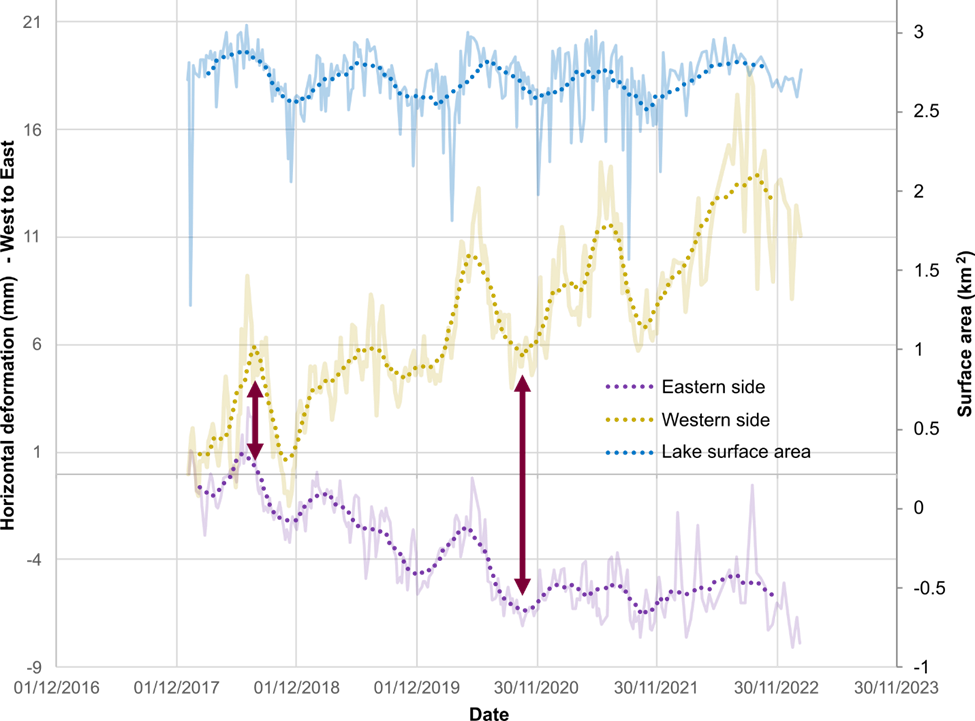
These seasonal variations in the reservoir level are causing the dam to flex downstream (subsidence + eastward horizontal movement) in the summer and rebound in the winter. This short-term deformation pattern is superimposed on a slower, linear long-term trend of movement downstream.
In an operational monitoring context, these measured displacements would be interpreted in the context of the expected behaviour of the structure. Dams are typically designed to accommodate an amount of displacement during normal operational conditions. InSAR measurements can be compared to the anticipated behaviour to confirm that this remains within safe limits, or where these have been exceeded prompt further investigations or mitigations.
CGG's InSAR measurements can be combined with Geocomp's ground-based assessment services to provide an integrated, comprehensive monitoring solution. To find out more, please contact the Satellite Mapping Team.
References:
Anastassopoulos, K., Hoek, E., Milligan, V., Riemer, W., 2004. Thissavros hydropower plant managing geotechnical problems in the construction. Proceedings, Fifth International Conference on Case Histories in Geotechnical Engineering, NY, April 13-17, 2004
Loupasakis, C., Rozos, D., Georgakopoulos, A., 2011. Remedial Measures for the Restoration of an Extensive Rock Slope Failure at the Right Abutment of the Thisavros Dam, Nestos River, Greece. Proceedings, Slope Stability 2011: International Symposium on Rock Slope Stability in Open Pit Mining and Civil Engineering, Vancouver, Canada (September 18-21, 2011)