After near 800 years of quiescence, the Fagradalsfjall volcano in Geldingadalur erupted in March 2021 and volcanic activity persisted for six months. Following weeks of moderate seismic activity on the Reykjanes Peninsula, including four earthquakes in excess of 4.5 Mw, another period of volcanism commenced on August 3rd, 2022. A 360 m long narrow fissure opened in the Meradalir Valley, ~1 km away from the site of the 2021 eruption. Lava was initially emitted at a rate of up to 32 m3 s-1, decreasing to 2 m3s-1 over the subsequent 2 weeks.
This article presents some excellent work recently completed by Amy Lloyd and Ben Conway-Jones from the Satellite Mapping InSAR team, showcasing the value of utilizing InSAR within a geological context to better understand the character of natural phenomenon of this type.
2022 eruption
Analysis of the 2021 eruption by the CGG Satellite Mapping group demonstrated the suitability of InSAR in quantifying the magnitude, spatial extent, and temporal evolution of this type of natural phenomenon. A similar approach was undertaken to characterize the 2022 eruption and compare it to the 2021 event.
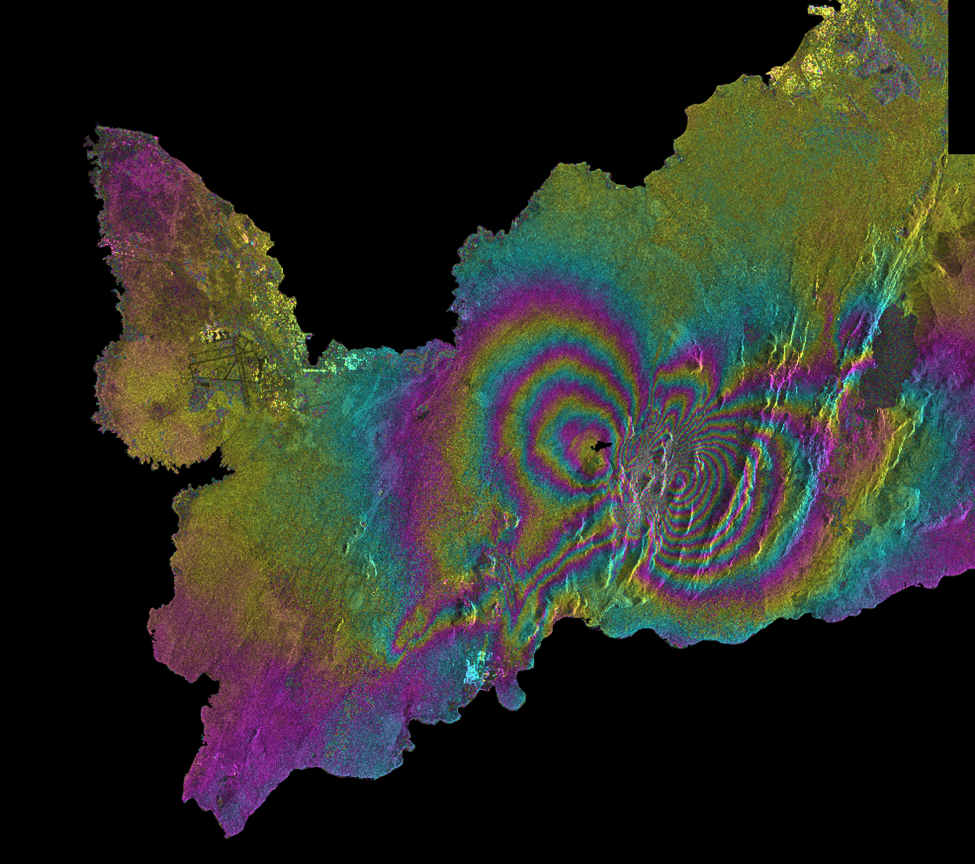
Figure 1 is an interferogram illustrating the phase difference between radar images taken either side of the eruption on 30/07/2022 and 23/08/2022. Images were taken from the descending (i.e., north to south) line of sight (LOS). Each rainbow stripe, known as a fringe, represents a change in distance of one phase (or π multiplied by the radar wavelength) between the surface and the satellite. Towards the earthquake epicenter, these contours become increasingly condensed, illustrating a significant degree of deformation.
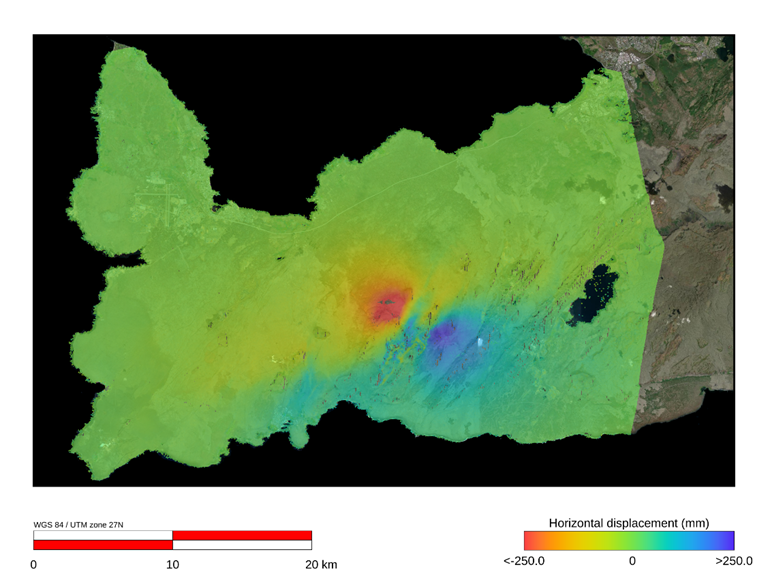
In order to determine the vertical and horizontal components of deformation over a long period of time, measurements were taken from both ascending and descending LOS over several months. Figures 2 and 3 show horizontal and vertical deformation of the Reykjanes Peninsula between April and October 2022.
Deformation over this period was dominated by signals centered on the Meradalir Valley, consistent with surface volcanism. The horizontal result shows movement along an ENE-WSW striking fault. The northern fault block is moving west, whilst the southern block is moving east. This tectonic movement is consistent with the mid-Atlantic spreading ridge that bisects the island, as the North American and Eurasian plates diverge.
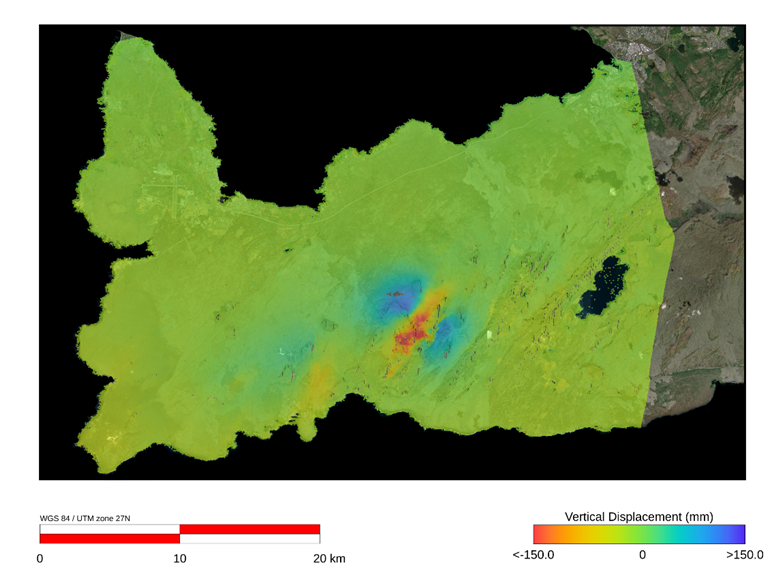
Since the fault is broadly strike slip, vertical deformation is not directly associated with tectonism. Instead, this more complex pattern is characteristic of dyke intrusion. Upward propagation of magma generates a net uplift signal. However, a trough of subsidence, known as a graben, is observed directly above the dyke.
Overall, this deformation signal is remarkably similar to the 2021 event. Horizontal deformation occurred in broadly the same orientation and is focused on the same fault segment (proximal to the Fagradalsfjall volcano). Notwithstanding, the magnitude and spatial extent is reduced.
The consistency of vertical deformation between the 2021 and 2022 events suggests the magmatic system is unchanged. This inference concurs with the finding that basaltic lava compositions between the two eruptions are nearly identical.
Tracking lava flow using InSAR
In many ways, the Reykjanes Peninsula is an ideal location for InSAR analysis. Rough, rocky ground provides strong consistent backscatter of incoming radar signals. Deformation is often substantial in both amplitude and spatial extent. Elevation changes are moderate and do not obstruct radar signals. However, in some cases, information can also be obtained from the absence of coherent data.
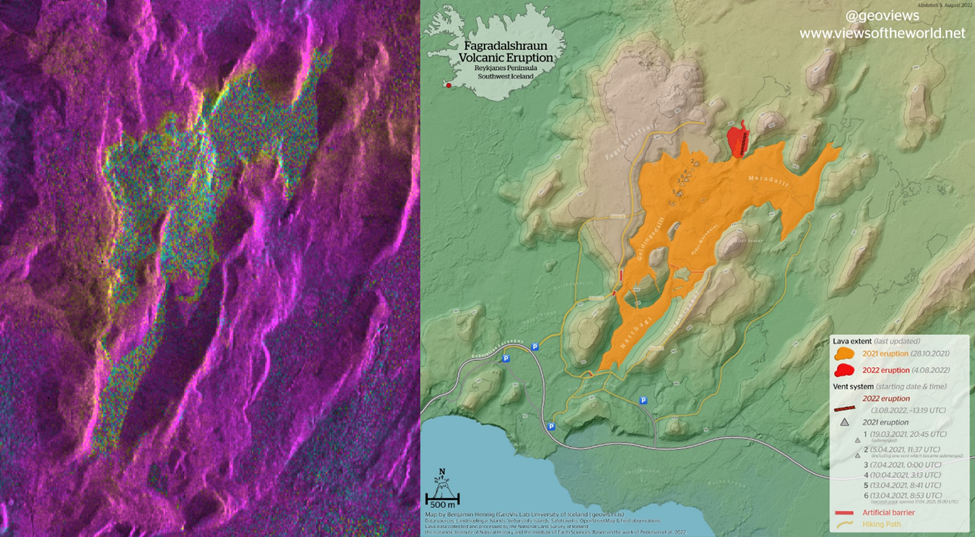
Figure 4 is an interferogram of the Fagradalsfjall volcano after the 2021 eruption. This image contains a well-defined area of noise, within which the surface has changed so considerably between the radar images that a coherent signal could not be obtained. This surface change is generated by the outpouring of lava and the extent of the noise reflects the extent of the lava field.
A timelapse of coherence maps from April 2021 to November 2021 is shown in Figure 5. Blue represents poor coherence (e.g., over the lava field) and yellow represents good coherence (e.g., over the stable rocky surface). Between April and May, the lava field rapidly expands and surges down the surrounding valleys. Over the summer months the lava field maintains its extent, but the consistent lack of coherence implies the field is still evolving. Towards the end of the timelapse, areas become coherent again as the flow rate decreases and the fringes of the lava field solidify. Unfortunately, winter snowfall causes a regional loss of coherence by November.
The lava field planform determined by InSAR shows excellent consistency with a map published using alternative satellite imagery and field observations. Our work demonstrates the suitability of InSAR in tracking lava flows. In fact, InSAR has some significant advantages over other satellite techniques. Radar data is regularly obtained, free to access and has sufficient resolution. Furthermore, radar signals are not obstructed by hazy atmosphere (e.g., cloud cover or volcanic smoke) and do not require sunlight.
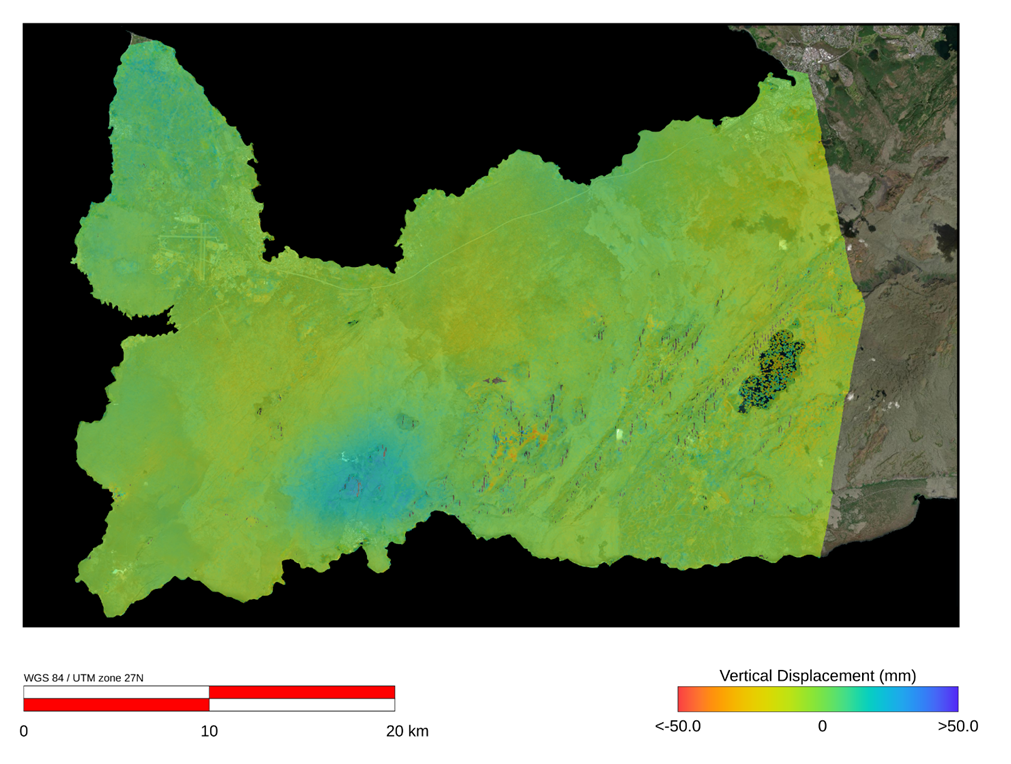
2022 uplift near thermal plant
Significant surface deformation on the Reykjanes Peninsula is not limited to spectacular volcanic and seismic events. Figure 6 is a map of vertical displacement between March and May 2022, a period of relative geological inactivity. During this time, a dome, up to ~2cm high, developed proximal to Mt. Thorbjorn.
Previous InSAR studies have documented staggered uplift in this area since 2020, attributed to activity within the Svartsengi volcanic system. Activity in this area has potential to pose a risk to nearby populations and infrastructure. The town of Grindavik, the Svartsengi power plant, and the Keflavik airport are all proximal to the epicenter of uplift.
If you'd like more information on this study, or our broader capabilities in the world of InSAR and remote sensing in general, then please feel free to reach out to us for a chat.