CGG’s Satellite Mapping team are collaborating with The University of Manchester to explore the potential insights that satellite imagery acquired by the Sentinel-5P satellite can provide with respect to changes in atmospheric trace gases during the unfolding global coronavirus pandemic.
Developed by the European Space Agency, the Sentinel-5P satellite mission focuses on atmospheric monitoring. The satellite hosts the TROPOMI instrument (TROPOspheric Monitoring Instrument), a spectrometer capable of mapping a variety of atmospheric trace gases.
Sentinel-5P is an excellent example of the ability of satellites to map baseline conditions and monitor changes to this, in this case on a global scale. Today, it is ideally positioned to observe the potential impacts of the coronavirus pandemic with respect to reduced anthropogenic activity, a key contributor to atmospheric trace gases.
We are downloading and processing Sentinel-5P Level 2 data products acquired across the entire globe every day to create a “live” archive, and over the coming days and weeks will publish a series of blog posts exploring these results.
As with all satellite imagery, the value is best unlocked through a combination of data processing, analysis, visualisation and domain expertise, so we are collaborating with Manchester University in order to share this data and provide informed explanations on what the satellite observations show.
Today, we are focussing upon some initial global nitrogen dioxide (NO2) results.
Professor Hugh Coe (Director of the Manchester Environment Research Institute at Manchester University) explains the role NO2 plays in the atmosphere: “NO and NO2 (or NOx) is formed during high temperature combustion and also as a result of soil microbiological production. Natural sources of combustion include lightning and wildfires but man-made emissions are far greater and arise through burning of wildfires and fossil fuels. In cities, motor vehicles are the dominant sources of NOx and once in the atmosphere NO is chemically converted into NO2. NO2 concentrations can be very high in cities and are a real concern because the gas is toxic. It inflames the lining of the human lung and as a result can cause inflammation leading reduced immunity to infections. In normal times, high traffic volumes represent one of the most serious public health problems and shorten lives of the population. Clearly, if air pollution persists during the coronavirus outbreak then the exacerbation caused by high pollution would add to the huge problems already faced. However, severe travel restrictions are not only reducing the chances of coronavirus infection spread but are drastically reducing emissions from road traffic.”
Harry McCormack (Innovation Lead at CGG Satellite Mapping) explains the data processing: “Sentinel-5P acquires (at a minimum) a daily global snapshot, and detectable NO2 levels are highly variable day-on-day linked to areas of cloud cover and changing weather conditions for example. Temporal filtering reduces short-term variation, supporting efforts to reveal trends in the underlying data occurring over timescales of weeks rather than days. Pixel-by-pixel data quality is an important consideration so the Sentinel-5P data has been thresholded at a quality value of 0.75. This is to account for partial cloud cover obscuring detection of NO2 close to the surface below the cloud.”
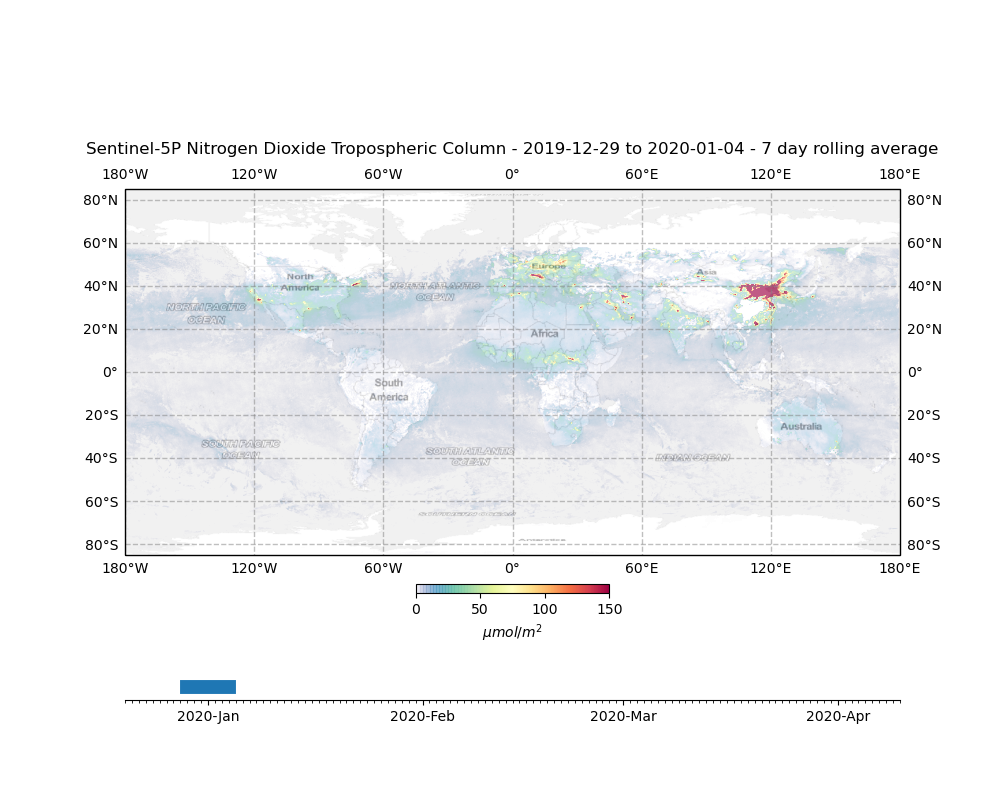
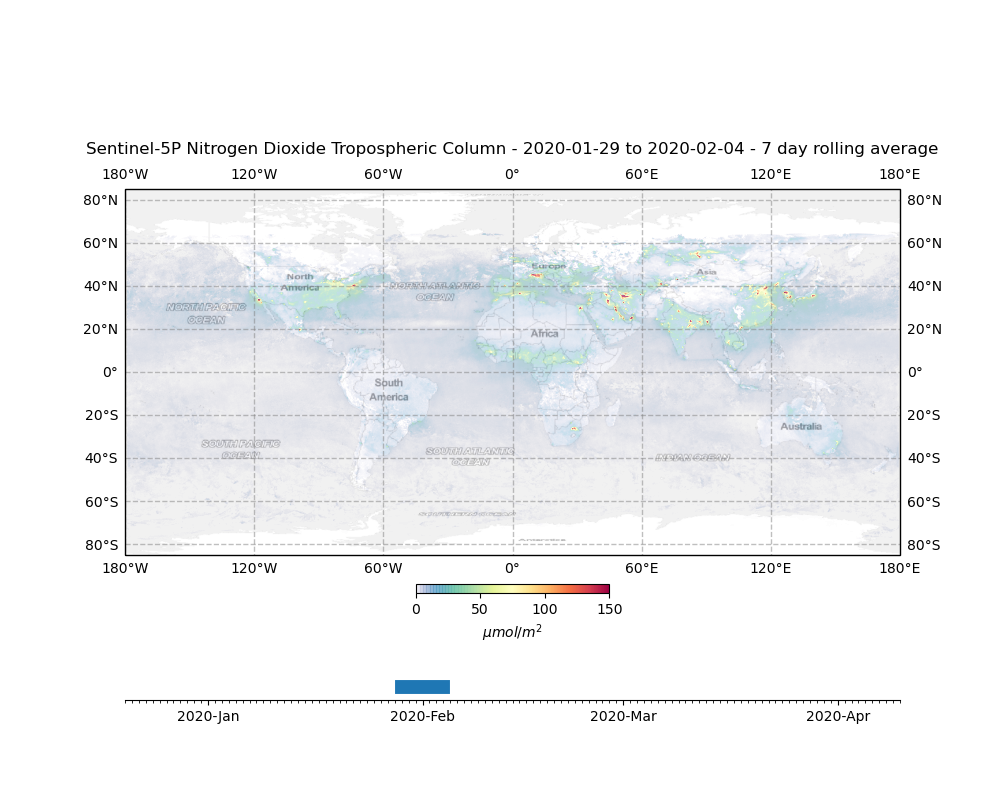
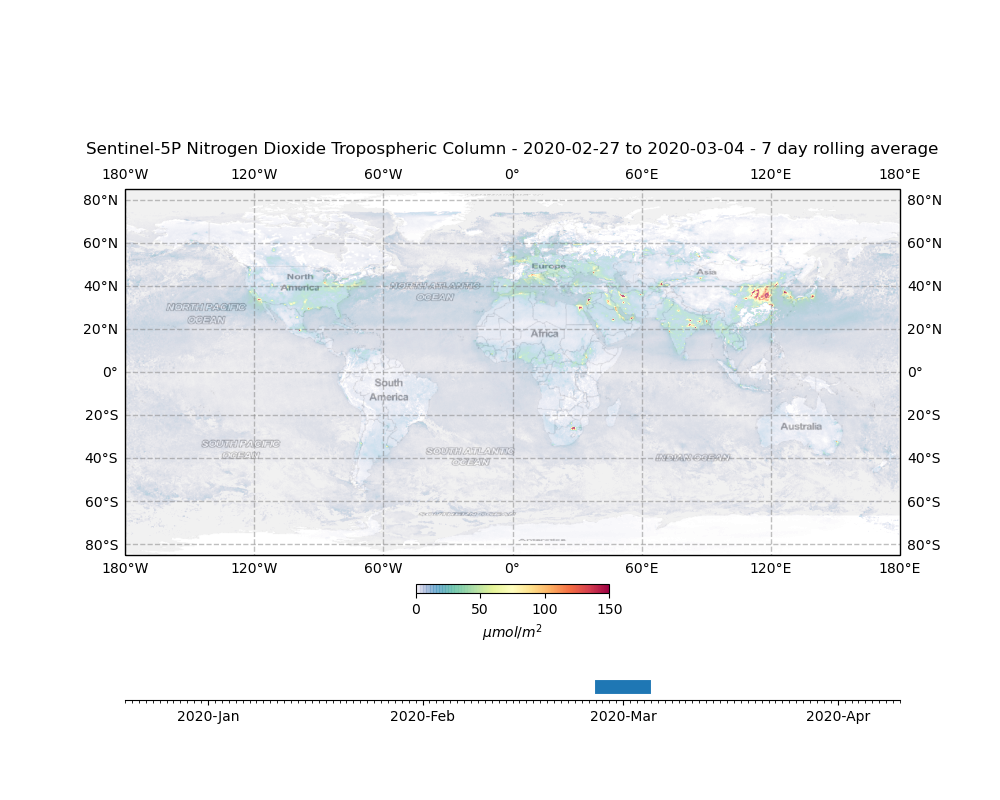
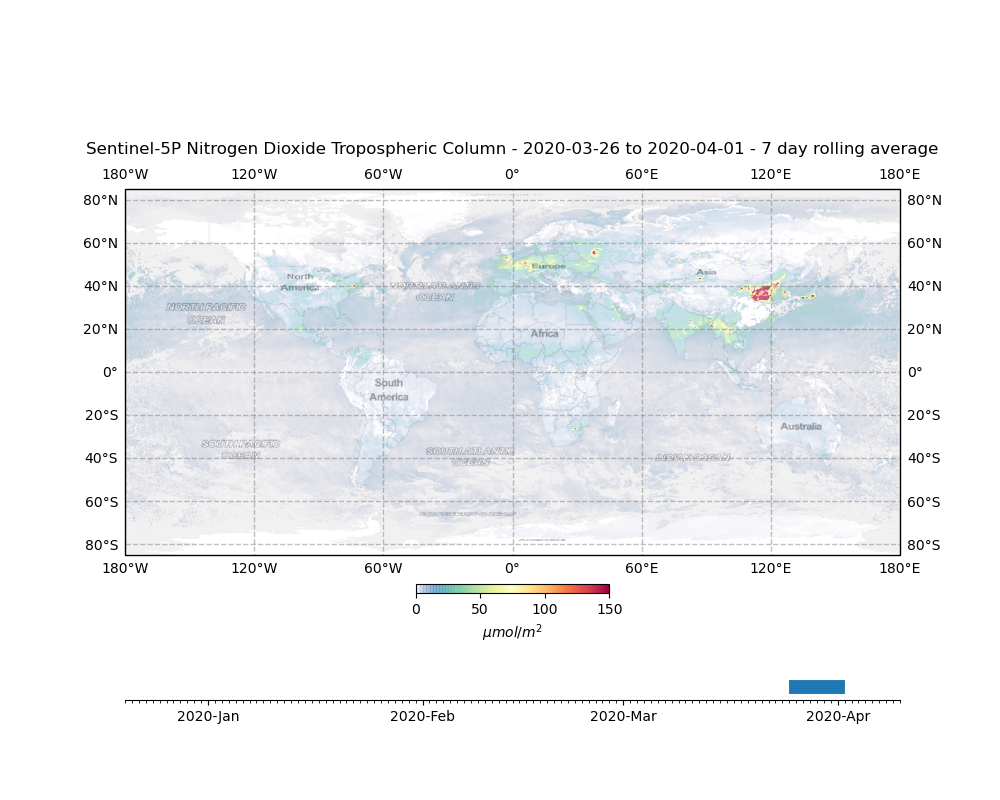
The following graphics visualise* Sentinel-5P data across the entire globe, using a seven-day rolling average centred on the beginning of January, February, March and April 2020. The NO2 data is represented using a colour map spanning 0 to 150+ µmol/m2.
Observations
The set of global images of the weekly average column of NO2 reveals some striking changes. In January, the world had not yet responded to the coronavirus. Very large column abundances of NO2 are seen across China. This is unsurprising since China hosts many of the world’s largest mega-cities and suffers very substantial NO2 emissions. In January, cold temperatures and low wind speeds lead to conditions that suppress mixing and high concentrations of pollutants result. High NO2 amounts can also be seen during January in other megacities such as Tehran (Iran) and Cairo (Egypt), whereas biomass burning is widespread across west Africa. In the US, the areas around the NE close to New York and Boston and in California around LA and San Francisco are also very marked. In Europe elevated levels are widespread but pollution thresholds were not exceeded. The exception to this is the Po Valley in northern Italy which, since it is home to Italian industry and during winter traps air between the Alps and the Apennines, is often polluted at this time of year.
By February, Wuhan and other cities in China had been shut down and the emissions of NO2 had dramatically reduced. This can be clearly seen in the drop in the NO2 column observed from TROPOMI. The column abundances of NO2 over northern Europe were also much less at the start of February than in January but this was before the shutdown. February in northern Europe was extraordinarily wet and windy and this led to large reductions in the NO2 column due to rapid dilution. These conditions lasted until mid-March and as a result, despite emissions reducing in early April as a result of shutdowns being initiated across Europe warmer, high pressure resulted in a modest increase in concentrations. However, by early April the shutdown in northern Italy and Spain and as a result the high columns of NO2 seen earlier in the year over the Po Valley and Madrid are absent. Drastic reductions across US cities are observed by the end of March as the shutdown was rolled out.
Caution also needs to be applied when looking at these data. For example, Tehran emissions in the final image cannot be observed since cloud cover obscures the region, whether or not reductions have taken place cannot be seen from this image. Conversely, Sentinel-5P cannot sample high latitudes during wintertime and as a result, emissions from Moscow cannot be observed until the end of March, though this is likely to be in time to see the changes induced by the recent shutdown. There is evidence of China’s recovery from the shutdown in the final image as the NO2 column density has increased significantly.
Next Steps
As we continue to download, process and analyse the Sentinel-5P data (spanning NO2 and a variety of other atmospheric trace gases) we will begin to take a more "local" focus (continental, country, major cities), investigate correlations with changing economic activity (downturn and recovery), and explore integration with ground-based observations. Keep checking back on The Satellite Mapping Blog for our latest findings.
*All visualisations have limitations in terms of displaying the full detail of the underlying data. For example, in order to show spatial variation in NO2 levels across the entire world the colour map has been scaled from 0 to 150+ µmol/m2. These graphics do not therefore reveal spatial variation in NO2 levels at more “local” levels above 150 µmol/m2.
Email: satellite.info@cgg.com
Telephone: +44 (0)1732 865023
Website: www.cgg.com/satellite
LinkedIn: CGG Satellite Mapping
Twitter: @CGGsatellite