Yesterday on both The Satellite Mapping blog and LinkedIn we posted some initial satellite-derived insights into the tailings storage facility (TSF) failure in Jagersfontein, South Africa, including some preliminary InSAR displacement data.
Since limited input SAR data is available today the InSAR measurements are shown in a single radar ‘line of sight’ (LOS), which is not always intuitive for non-InSAR experts to interpret.
So, here is a quick explainer detailing what those LOS InSAR measurements do and don’t tell us about the possible mechanism of failure.
Viewing geometry
The InSAR displacement results were derived from satellite Synthetic Aperture Radar (SAR) data acquired on the ascending orbit pass, with the satellite flying from approximately south to north and viewing the site at an inclined angle from nadir, from the west. This viewing geometry represents the LOS of the satellite-based SAR instrument with respect to the target.
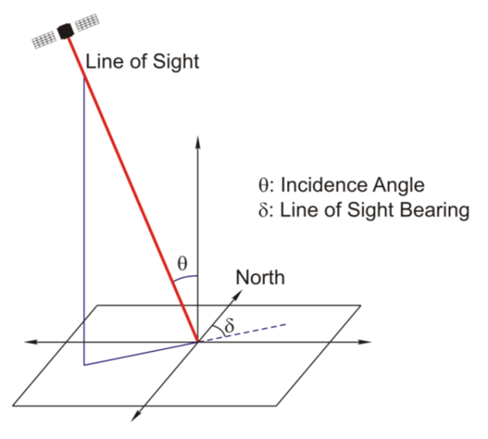
InSAR measures a one-dimensional component of displacement along the LOS (either towards or away from the satellite). With this viewing geometry, movement towards the satellite can occur if the ground moves upward, or in a westward direction – or a combination of both. Similarly, movement away from the satellite can correspond to downward and/or eastward displacement. For this dataset the incidence angle (θ) is 32°, making it relatively sensitive to the east-west components of displacement.
Where possible, we try to combine InSAR results derived from SAR data acquired on both ascending and descending orbit pass viewing geometries, to give us measurements from both easterly and westerly directions. This enables us to resolve these one-dimensional displacements into vertical and east-west components. Unfortunately in this case suitable descending SAR data is not available for this site. Since the SAR satellites never view the area looking north- or southwards, InSAR cannot detect any north-south components of horizontal displacement.
Interpreting LOS displacements
The first-look InSAR measurements across Jagersfontein (below) show areas of consistent displacement both towards the satellite (blue) and away from it (red), along that sloping LOS. While they clearly show when and where movement occurred, we can’t separate that displacement out into 3D components to show exactly which direction it moved in.
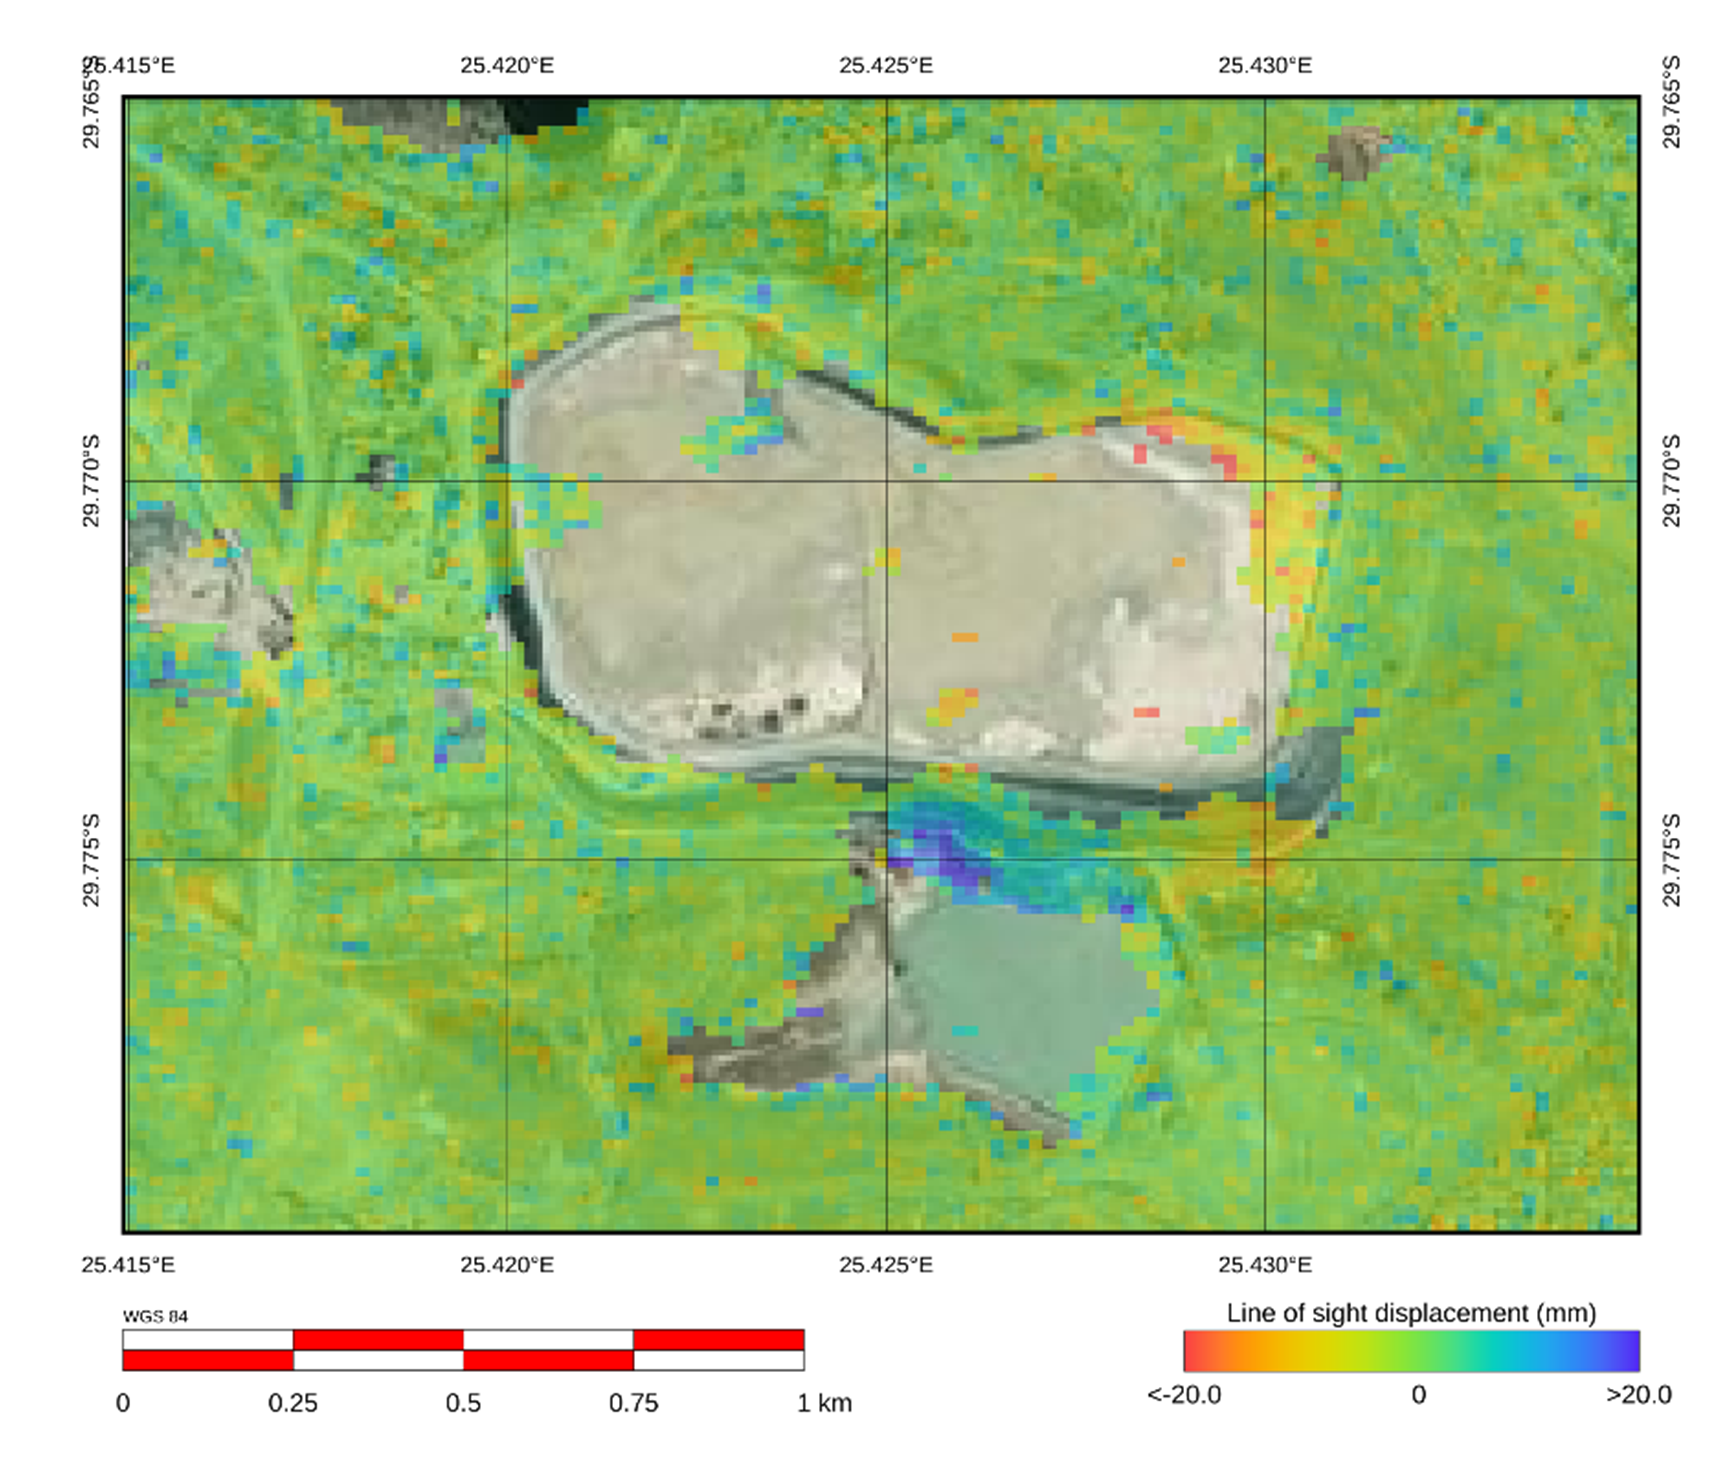
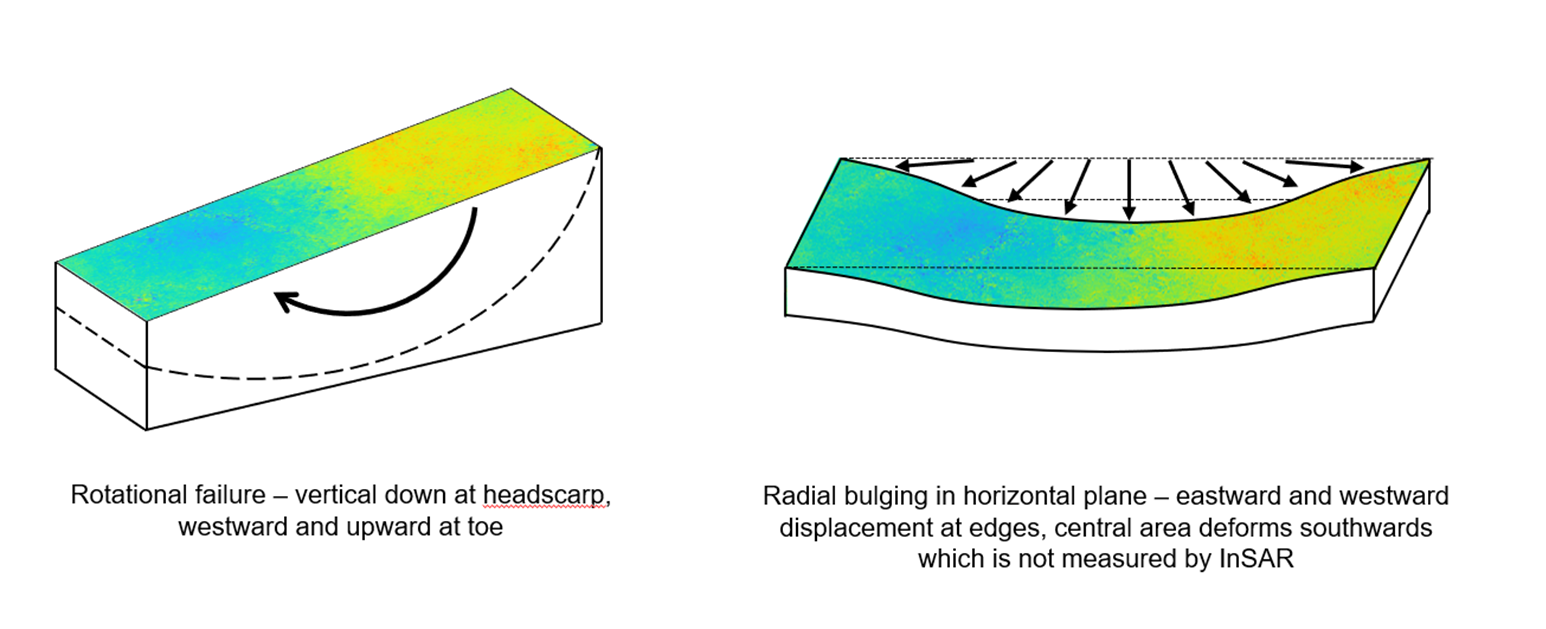
Any interpretation needs to consider the plausible ground deformation mechanisms that could result in that specific pattern of LOS displacement. The InSAR results show displacements in an area around the failure location, with the western section moving towards the radar (up and/or west), and the eastern section moving away (down and/or east). There are multiple mechanisms that could result in such a signal, with two contrasting examples shown below. While knowledge of the site and of similar failures make the horizontal ‘bulging’ mechanism seem more plausible, without additional information it is not possible to confirm whether either of these mechanisms could be a feasible model for this failure, or link to any particular cause.
For more information on InSAR please get in touch with our expert team.