Coronavirus lockdowns continue to have an unprecedented impact on day-to-day life around the globe. Satellite imagery provides a unique means of measuring and tracking variations in nitrogen dioxide across different regions and provides a unique insight into changing levels of activity. In this post we focus on changes in greenhouse gases across China and Europe since the beginning of the year.
Check out our first blog post on this topic for more detail on the Sentinel-5P satellite and the role NO2 plays in the Earth's atmosphere.
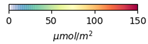
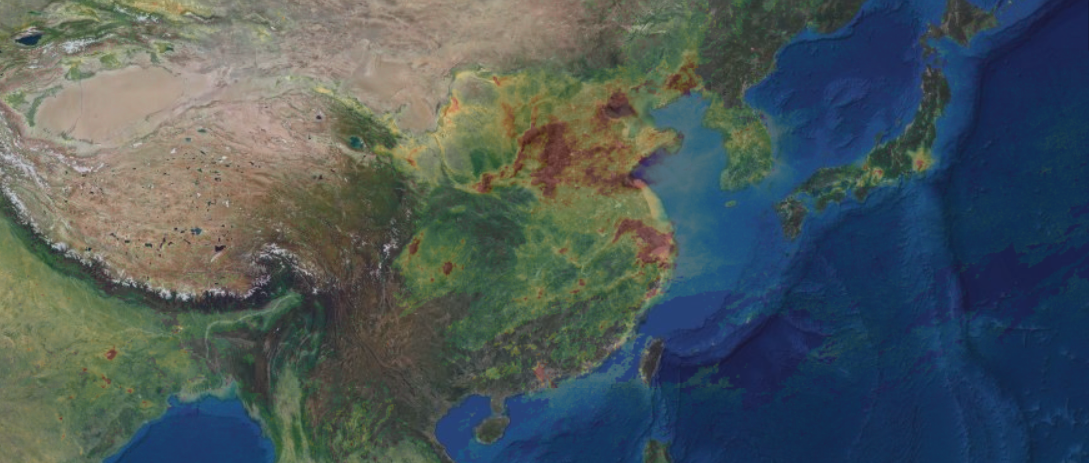
The Sentinel-5P satellite imagery has been processed on a global scale to a seven-day rolling average using a quality threshold of 0.75. The following graphics visualise the derived concentrations of NO2 on a sliding scale of 0 to 150+ µmol/m2:
CHINA
31st December 2019: China informs the World Health Organisation (WHO) about a cluster of pneumonia cases in the city of Wuhan, the capital of Hubei Province. The contribution of large cities, significant industrial activity and winter heating demands are reflected in the high levels of observed NO2 in northeast China.
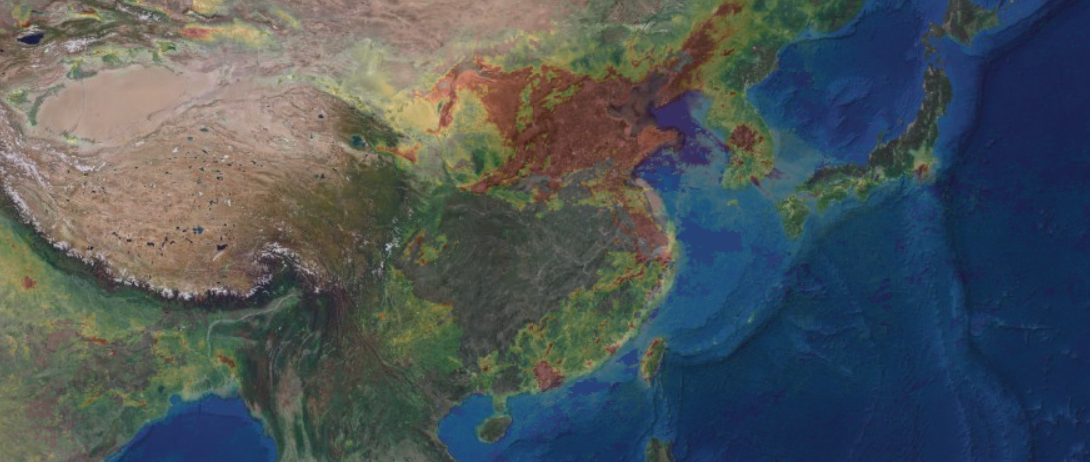
23rd January 2020: China begins lockdown. NO2 levels reduce compared to the beginning of the month although this is considered fairly typical as Chinese New Year celebrations around this time are likely to lead to coincident reductions.
23rd February 2020: One month into lockdown and we observe wide-scale reductions in NO2 correlating with decreased economic activity.
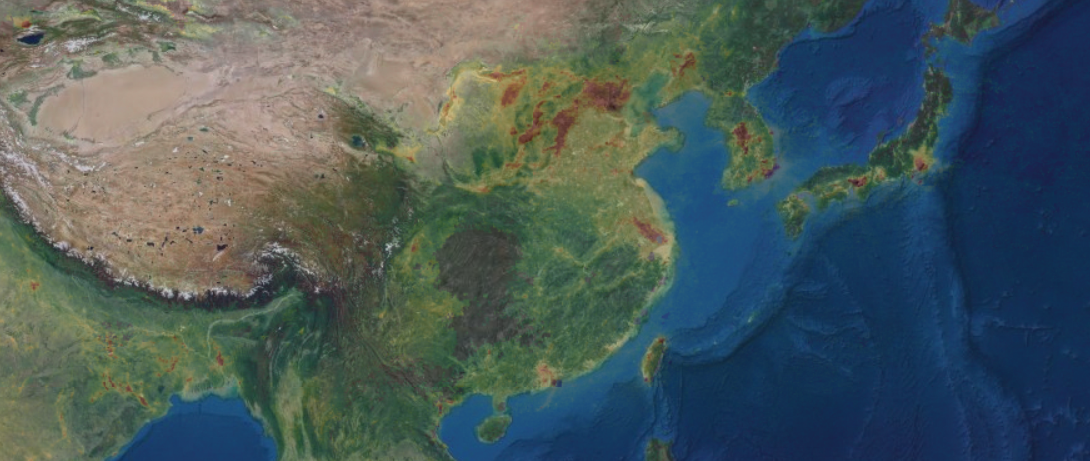
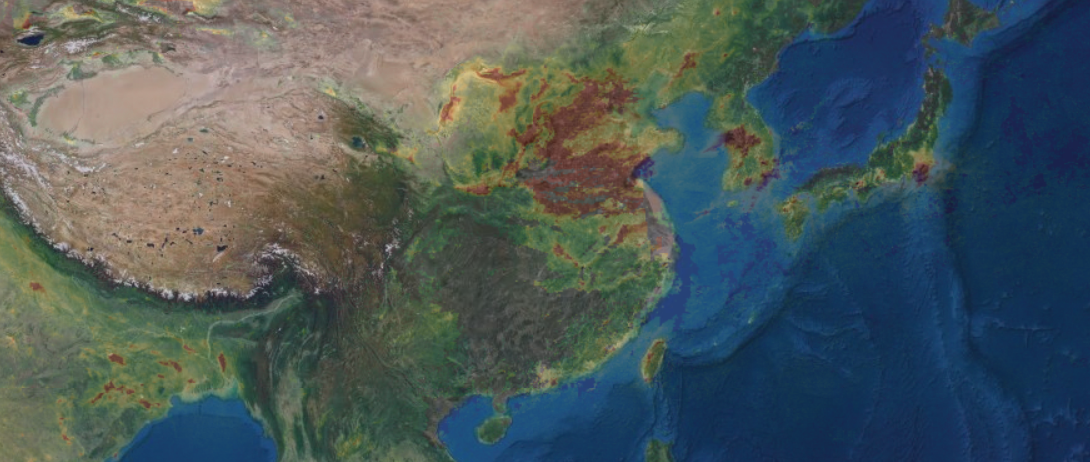
26th April 2020: Increasing levels of NO2 are observed as restrictions ease across China. Levels are lower than at the start of the year, however reduced demand for heating during warmer months likely results in a predictable seasonal cycle.
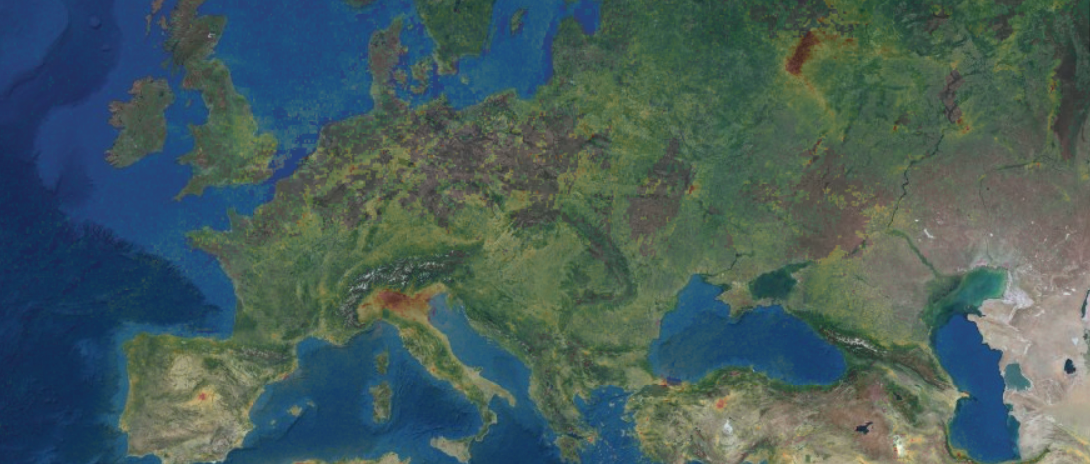
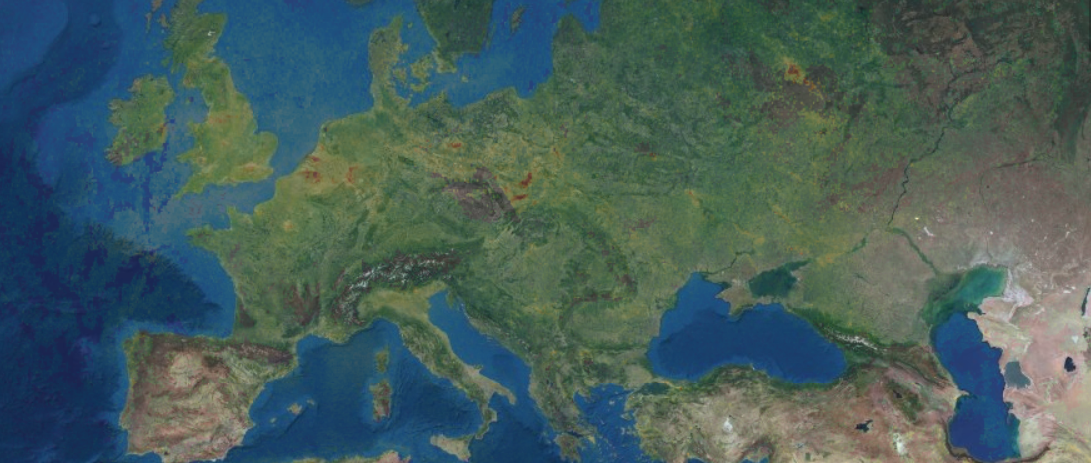
EUROPE
23rd February 2020: While China was one month into lockdown, Italy announces the first lockdown in Europe. Observed NO2 levels are high in northern Italy, where pollution is trapped by the Alps, and Moscow and Madrid also stand out. The low levels of NO2 observed across much of northern Europe is primarily due to high wind speeds rapidly dispersing the gas rather than an absence of emissions.
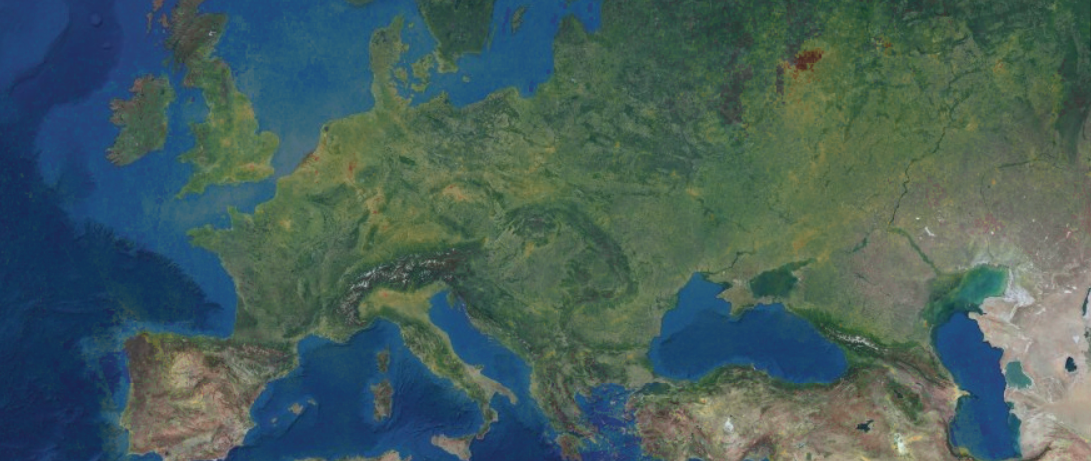
5th April 2020: Two weeks into lockdown in the United Kingdom and NO2 levels across Europe are very low.
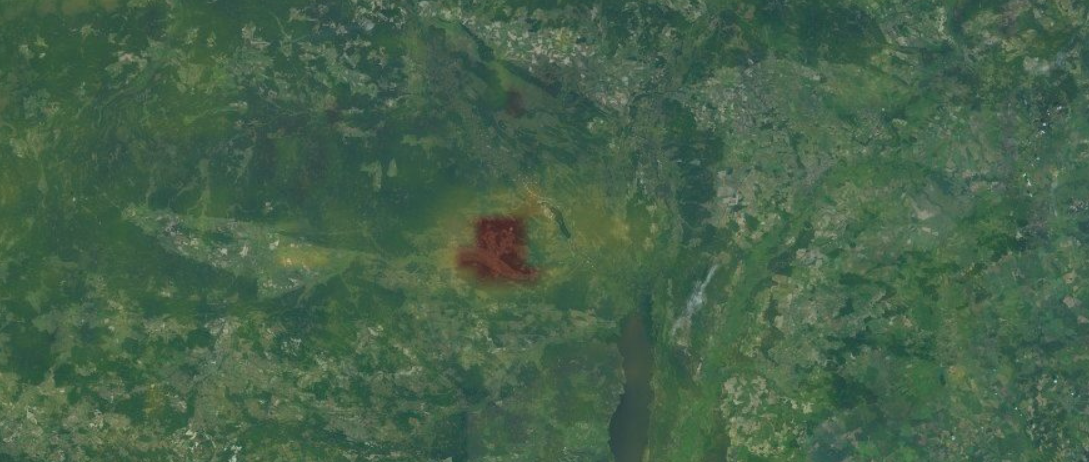
14th April: An area of high NO2 is observed near Chernobyl, Ukraine correlating with forest fires in the region.
26th April 2020: Lockdowns begin to ease across some European countries however NO2 levels remain low. Increased levels are observed across some key industrial areas e.g. Rotterdam, Ruhr Valley.
Keep checking back on The Satellite Mapping Blog for our latest findings as we continue to download, process and analyse the Sentinel-5P data spanning NO2 and a variety of other atmospheric trace gases.
All images © CGG. Contains modified Copernicus Sentinel data (2020).
Email: satellite.info@cgg.com
Telephone: +44 (0)1732 865023
Website: www.cgg.com/satellite
LinkedIn: CGG Satellite Mapping
Twitter: @CGGsatellite